DIAVLOS
![]()
![]()
![]()
![]()
![]()

Demonstration of DIAVLOS operational tool
(and a hypothetical accident near Alexandroupolis oil-pipe terminal - N.E. Aegean Sea)
The operational tool is an Oil Spill Dispersion Forecasting System, which covers the area of the North Aegean Sea between 22.5 - 27.1 oE and 38.9 - 41.1 o N. The atmospheric and oceanographic conditions that dominate in this area are provided by three main Forecasting Systems. The oceanographic data originate from the North Aegean High Resolution Forecast, which has a resolution of 1n.m. The wave data originate from the SKIRON Wave Forecast System, while the atmospheric data from the SKIRON Weather Forecast System, both having a resolution of 3n.m. The available data cover a period of 61h, starting from the present day at 00:00 and the oil spill forecast system provides a forecast of maximum 48h within this period.
The operational tool is addressed to certain users, password protected and accessed through "mydiavlos". The necessary information for the model to run are the oil spill site (longitude, latitude), the initial oil volume released, the oil release time and finally the oil type (light-volatile, non-sticky, heavy sticky and nonfluid oil). Figures 1 and 2 show the windows of mydiavlos and of oil spill forecast results respectively.
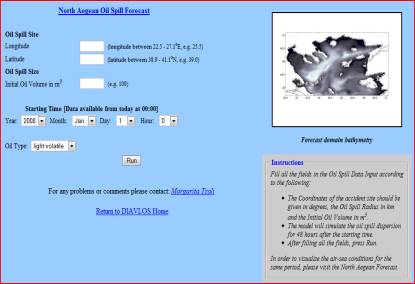
Figure 1.1. Mydiavlos Window
|
Acceptable input:
|
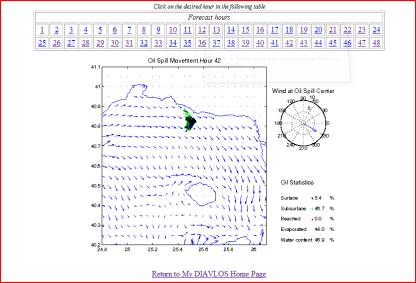
Figure 1.2. Oil Spill Forecast Results Window
| When you click RUN the data are being processed (it takes a few minutes) and a popup window is opened. At the end of the processing, you will be redirected to a new window (see Figure 1.2). Select the forecast images from the table indicating hours after starting time. If an image does not appear it means that it is still processed OR the hour selected exceeds the forecast period! |
The simulated "accident"
The demonstration is based on a hypothetical accident in the greater region of Alexandroupolis port, at the terminal site of the Burgas - Alexandroupolis pipeline (the pipeline will transport 35 million tons of oil per year).
In this demo the oil release is specified as an instantaneous release of 1000 tons of light paraffine-base oil and the accident time is the 15th of April 2008 at 12:00. The exact location of the accident site is 25.5oE - 40.8oN.
Watch Demo Movie
The results are hourly and snapshots of the oil-spill position after 1h, 24h and 48h are given in Figures 2.1, 2.2 and 2.3. The oceanic surface velocity fields are superimposed in each figure, as well as the wind velocity at the oil spill centre. The purple star indicates the oil release site. Black colour indicates oil at the surface, green, dispersed oil in subsurface layers and red, oil that reached the coast. The percentages for the oil volume that undertook those weathering processes are available, as well as those for the evaporated and emulsified volume of oil.
Figure 2.1. The first hour after the accident 90% has dispersed to subsurface layers and only 10% remains at the surface. |
Figure 2.2. A day after the accident the oil has moved towards the Thracian coast, while the greater portion of the oil at the surface evaporated. |
Figure 2.3. Two days after the accident 2% of the oil has reached the Thracian coast. |
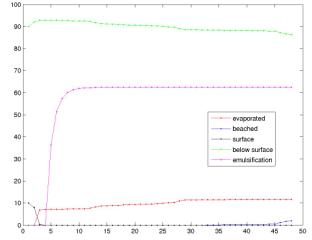
Figure 2.4. Results for the oil weathering processes changes, as a function of time. 5 hours after the oil release, the model predicts about 90% oil dispersal to deeper layers and 10% evaporation. Only 2% of the oil volume reached the coasts of Thrace after 48 hours of simulation. |
Return to DIAVLOS Home